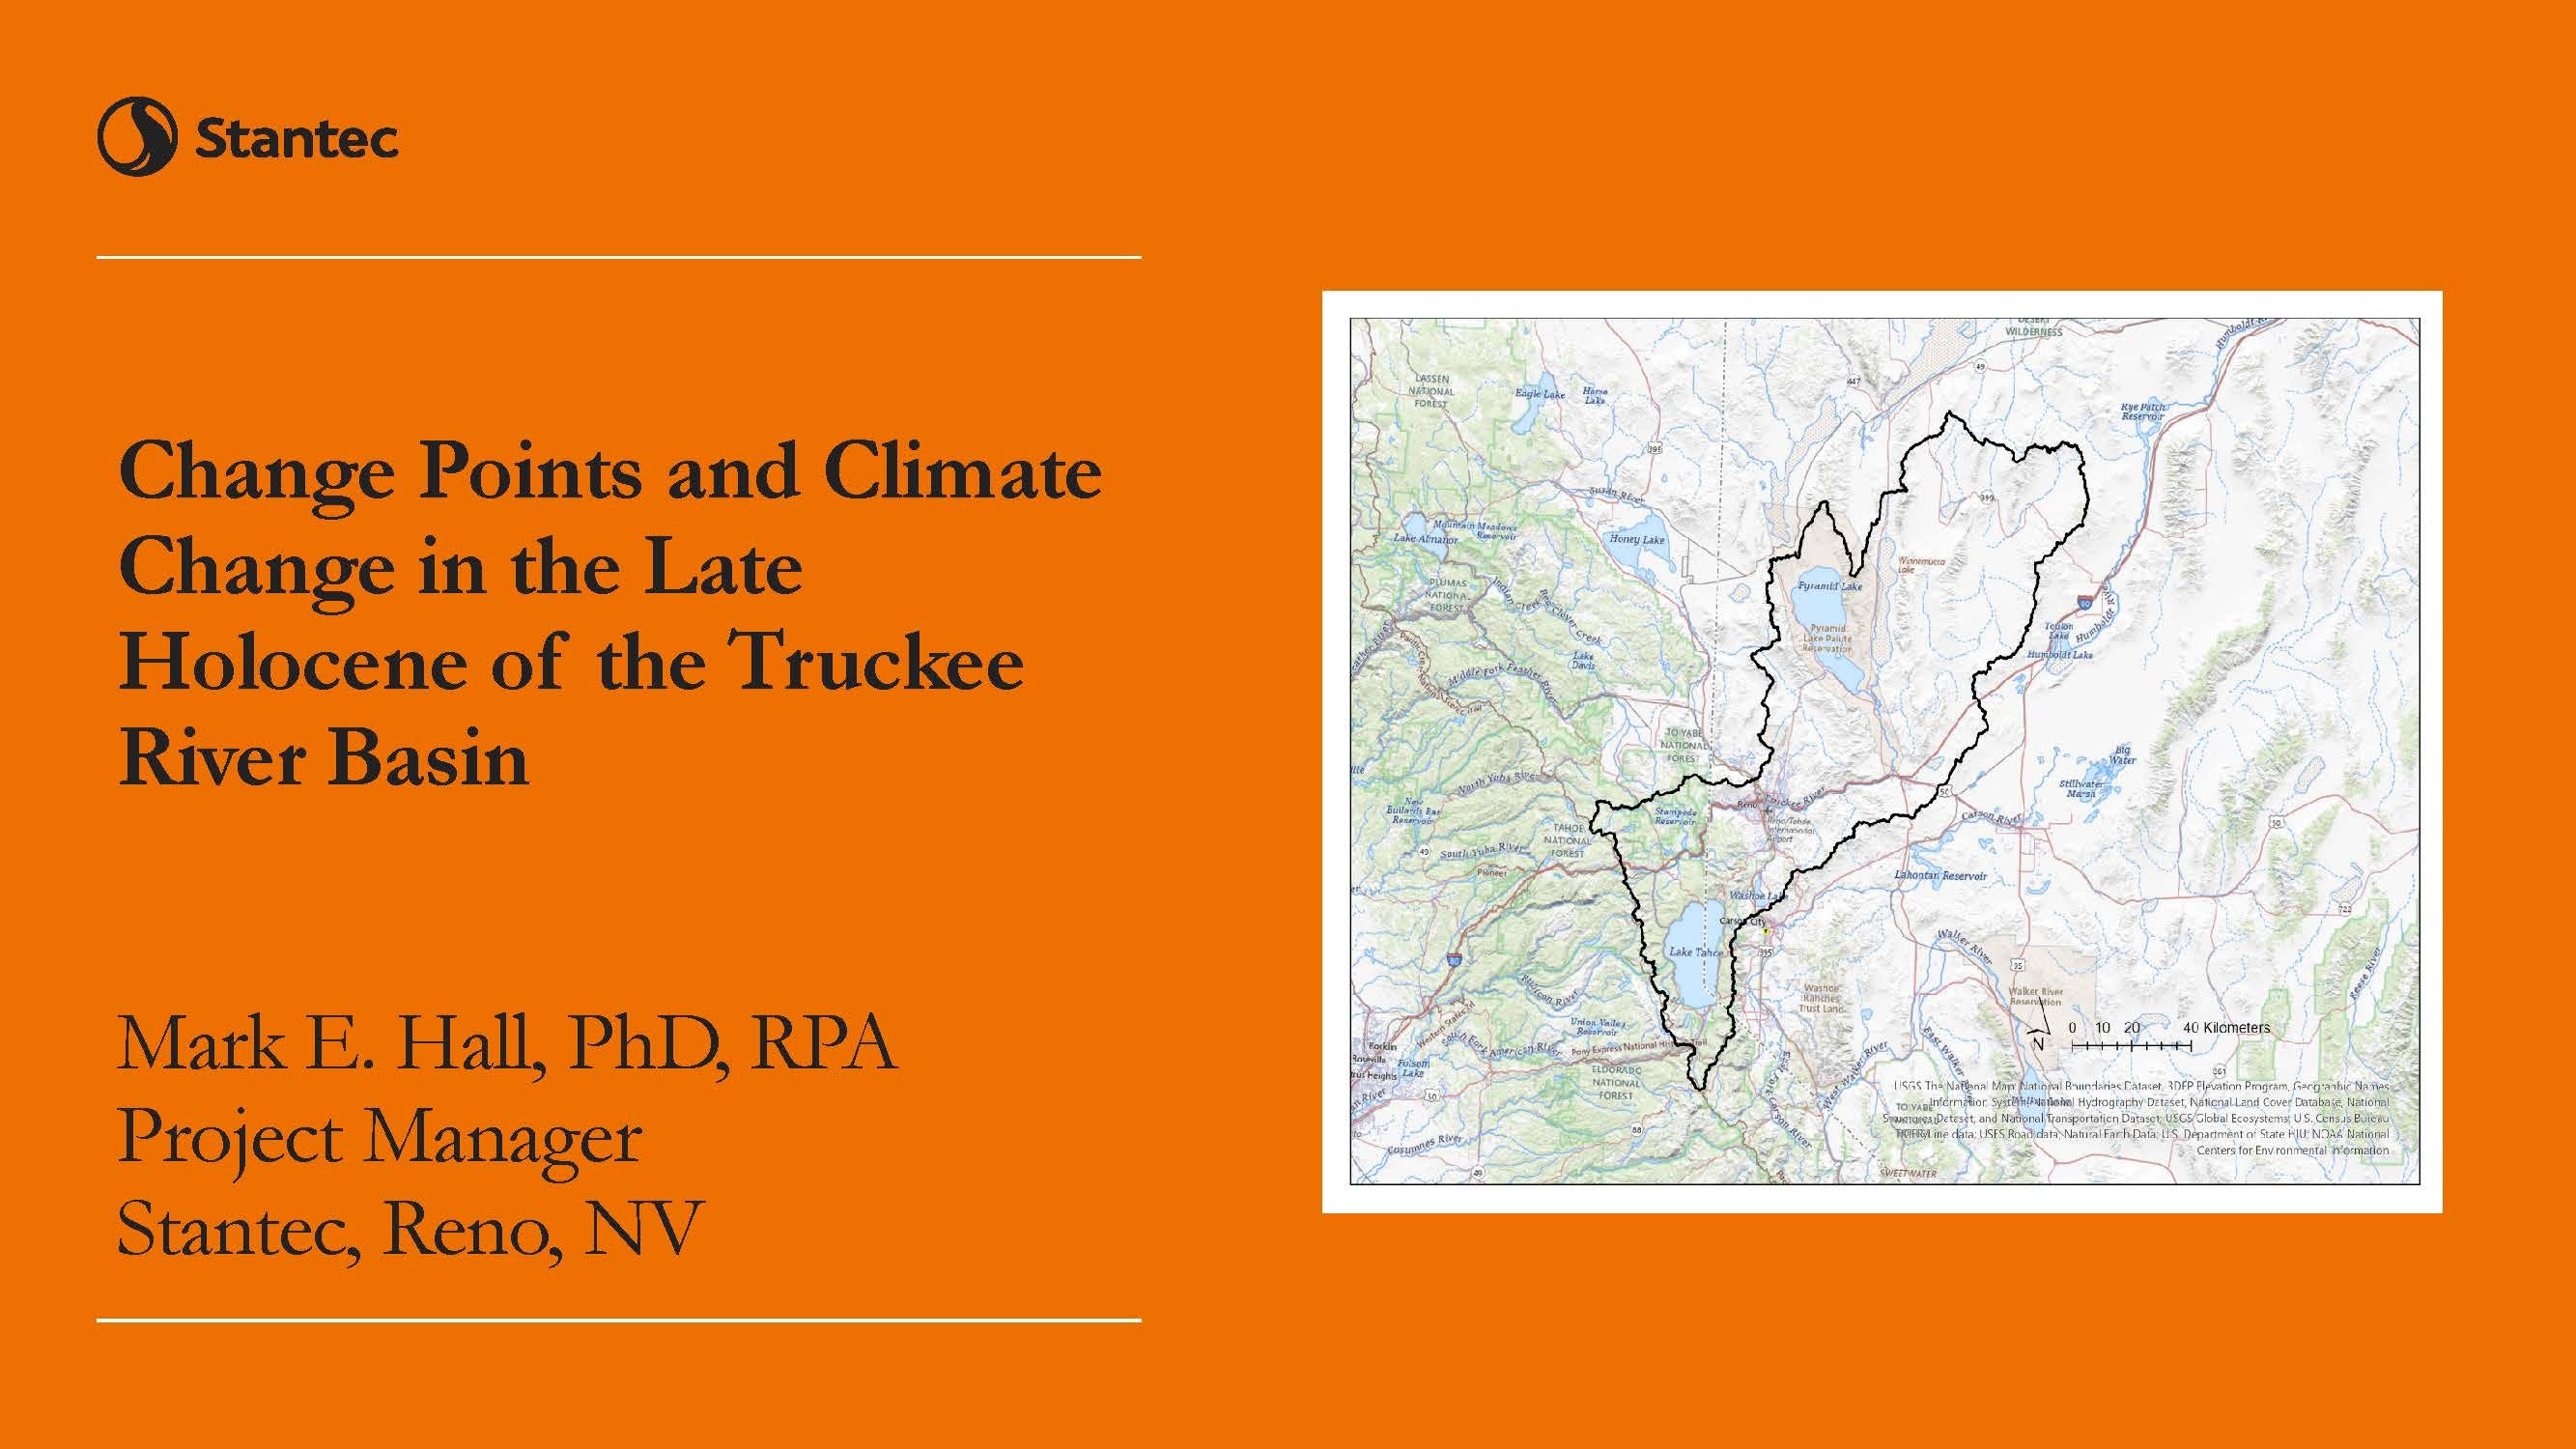
Change Points and Climate Change in the Late Holocene of the Truckee River Basin
The presentation for the 2025 Great Basin Anthropological Conference

Given the aridity of the Great Basin, the role of climate and climate change has been one of the elements in viewing cultural change and evolution in the Great Basin. With the assemblage of radiocarbon databases, relatively cheap computing power, and a variety of statistical techniques, archaeologists are now in a better position to look at the role of climate change and cultural evolution.
This study is looking at human activity during the Late Holocene in the HUC-6 Truckee River basin. Time period under study is 4200 BP to 40 BP.1
The question attempting to be answered is: how has human activity been impacted by climate and climate change in the Truckee River basin?
To answer the question, 311 radiocarbon dates dates from 73 sites between 3900 and 40 bp are used.2
Database creation started during COVID shut-down; drawn primarily from BLM, USFS, USACE cultural resource reports, plus published articles, and some Nevada State Museum records. Initial presentation of the data at the 2020 AGU and 2021 SCA meetings. Didn’t rely on CARD due to issues with it at the time. Updated in 2024 with more reports and some dates from CARD and p3k14C (23% from those two sources).
The radiocarbon determinations are from terrestrial material in human created contexts or artifacts, and a few human remains. No aquatic material nor soil humic fractions or geologic samples are used in this study.
Climatic phases/events of interest in this presentation:
Late Holocene Dry Period (LHDP) ca. 3100-1800 BP
Late Antique Little Ice Age (LALIA) ca. 1424-1290 BP3
Medieval Climatic Anomaly (MCA) ca. 1058-600 BP
Little Ice Age (LIA) ca. 380-200 BP
The method of analysis is using a Bayesian inhomogeneous Poisson process to look at changes in the rate of human activity. These changepoints are then examined for when they occur in relation to climatic phases.
You may be asking, why are you doing something new, and not using Summed Probability Distributions? Well, …
Problems with Summed Probability Distributions (SPDs):
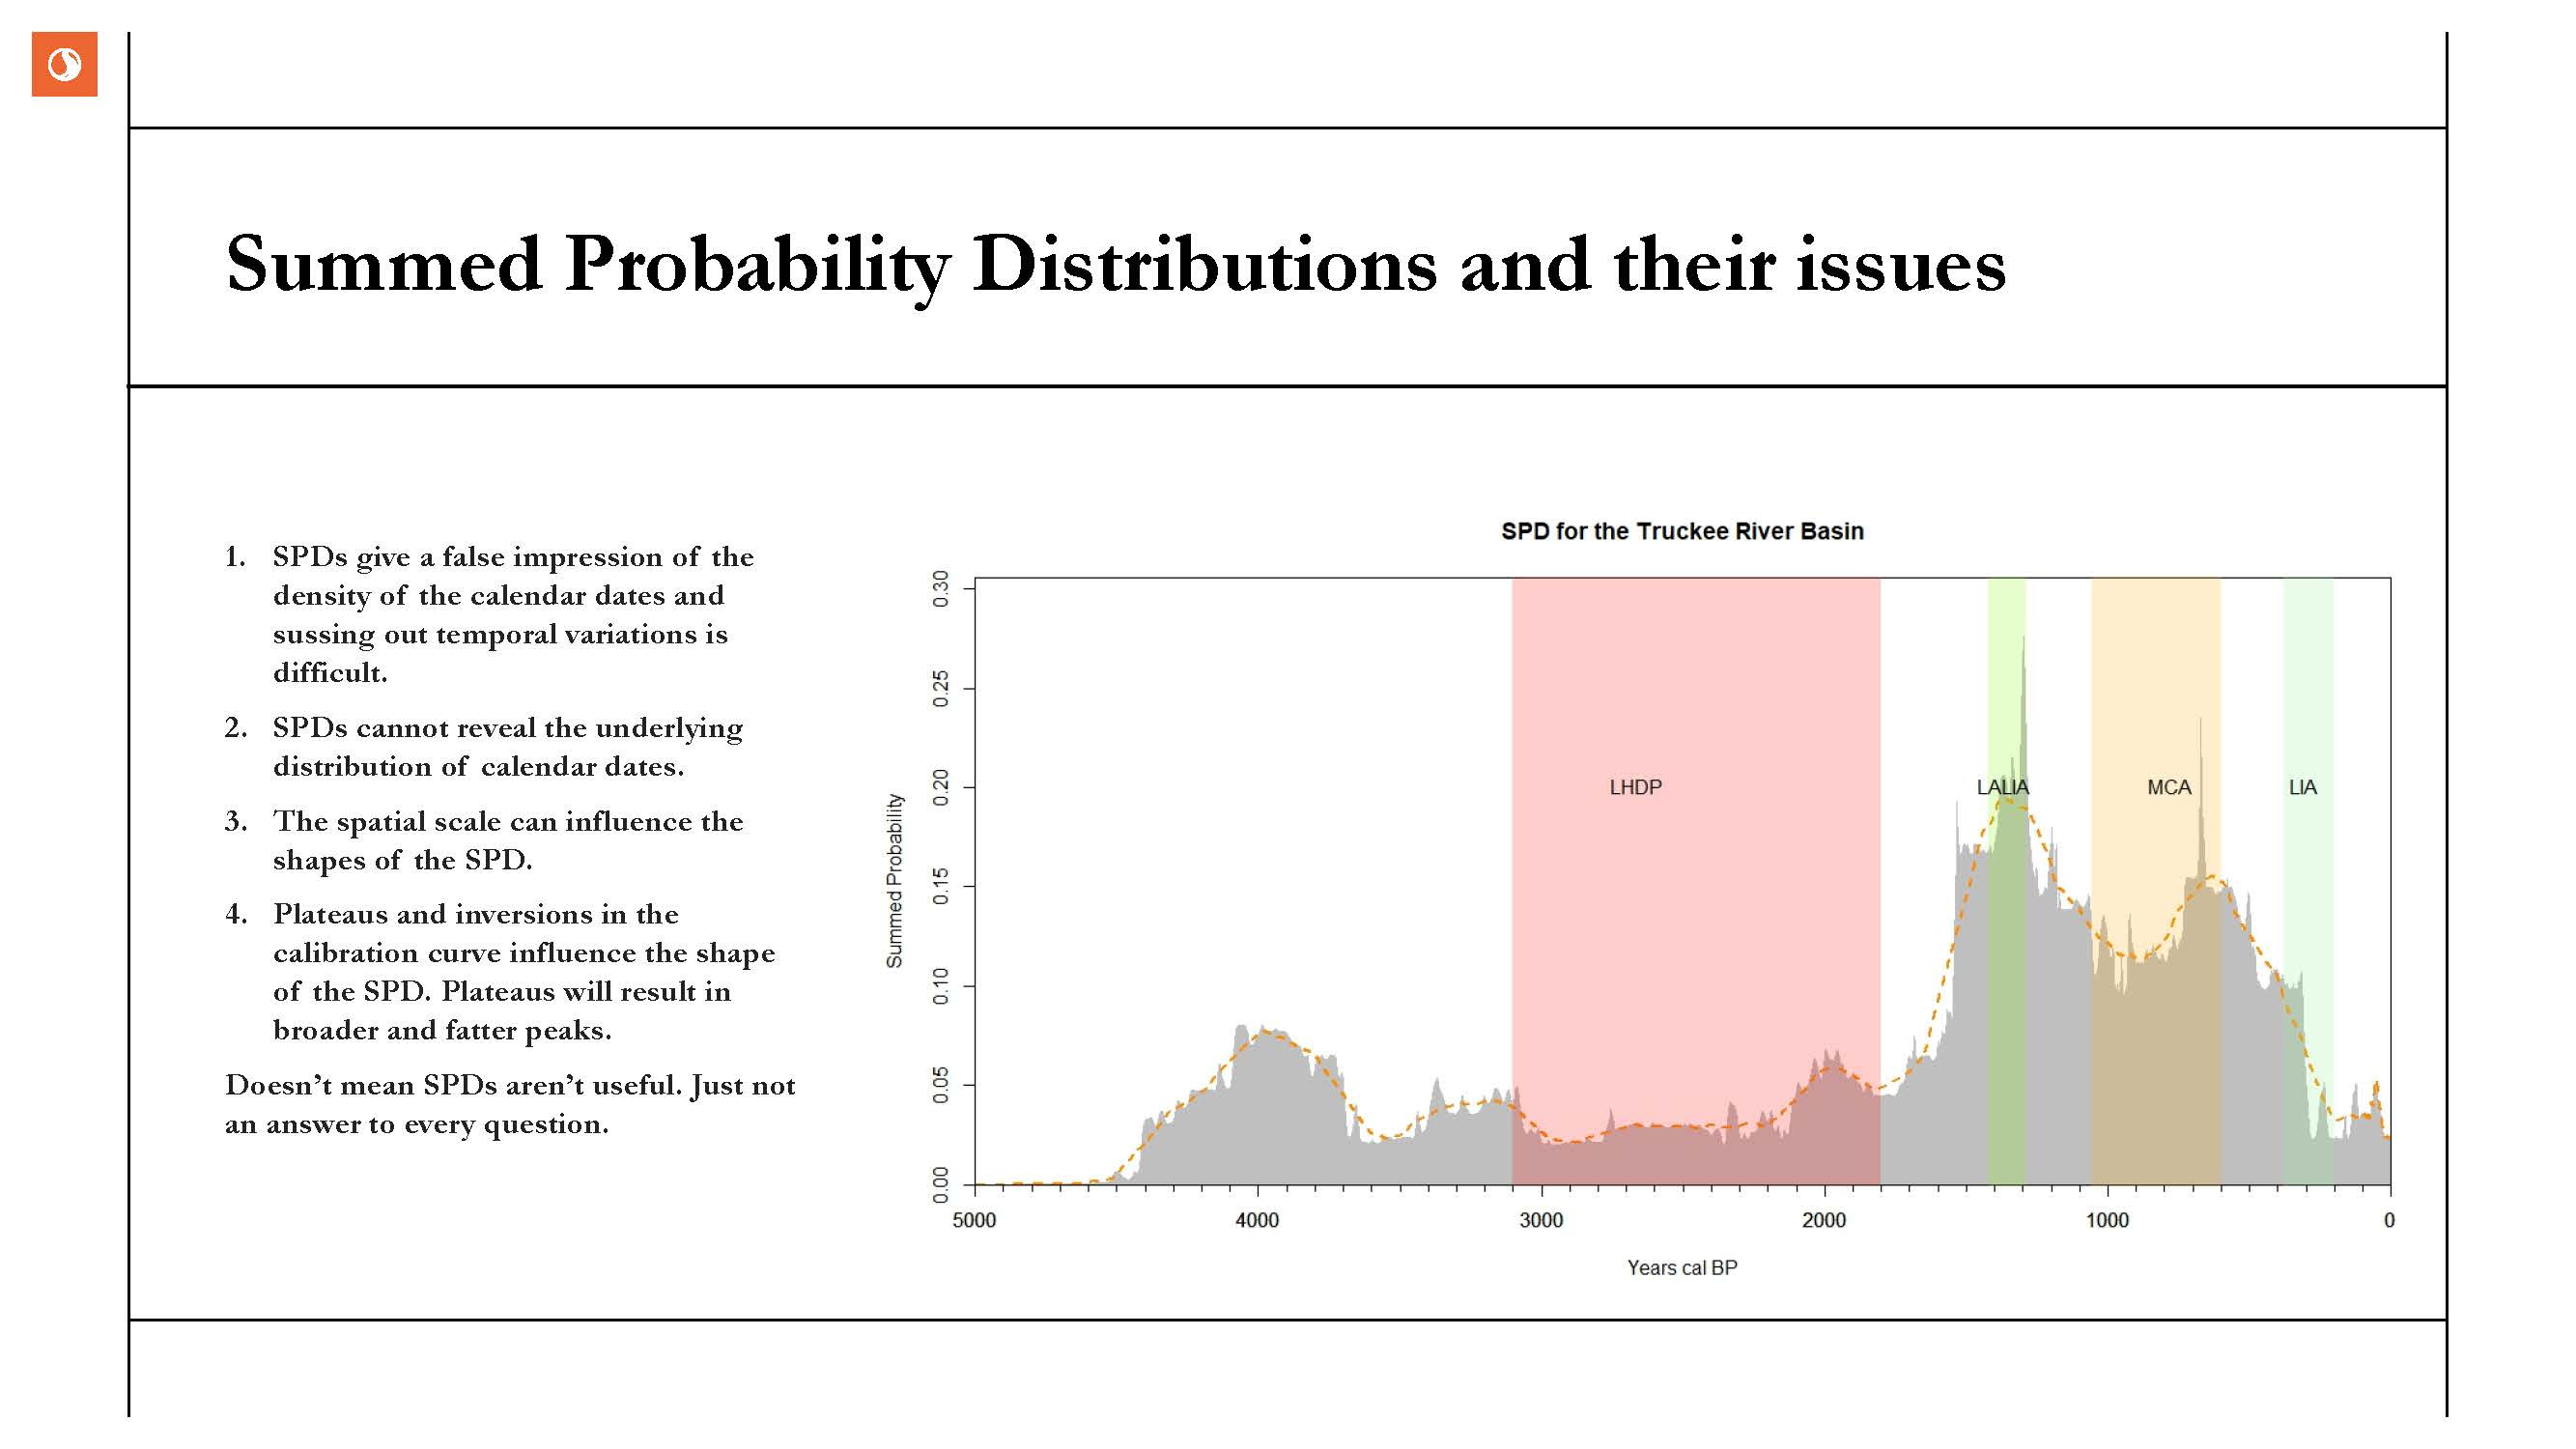
Give a false impression as to the density of calendar dates. As documented by a variety of authors (Carleton and Groucutt 2020; Crema 2022), SPDs have limited ability to accurately provide estimates of temporal variations in the calendar age density of the radiocarbon samples.
Each radiocarbon determination is calibrated separately; doesn’t reflect the originating calendar distribution of calendar dates.
SPDs are heavily influenced by plateaus and inversions in the calibration curve.
Doesn’t mean SPDs shouldn’t be used, it is just as Crema noted in 2022, they have their utility to answer certain questions, but aren’t a universal hammer.
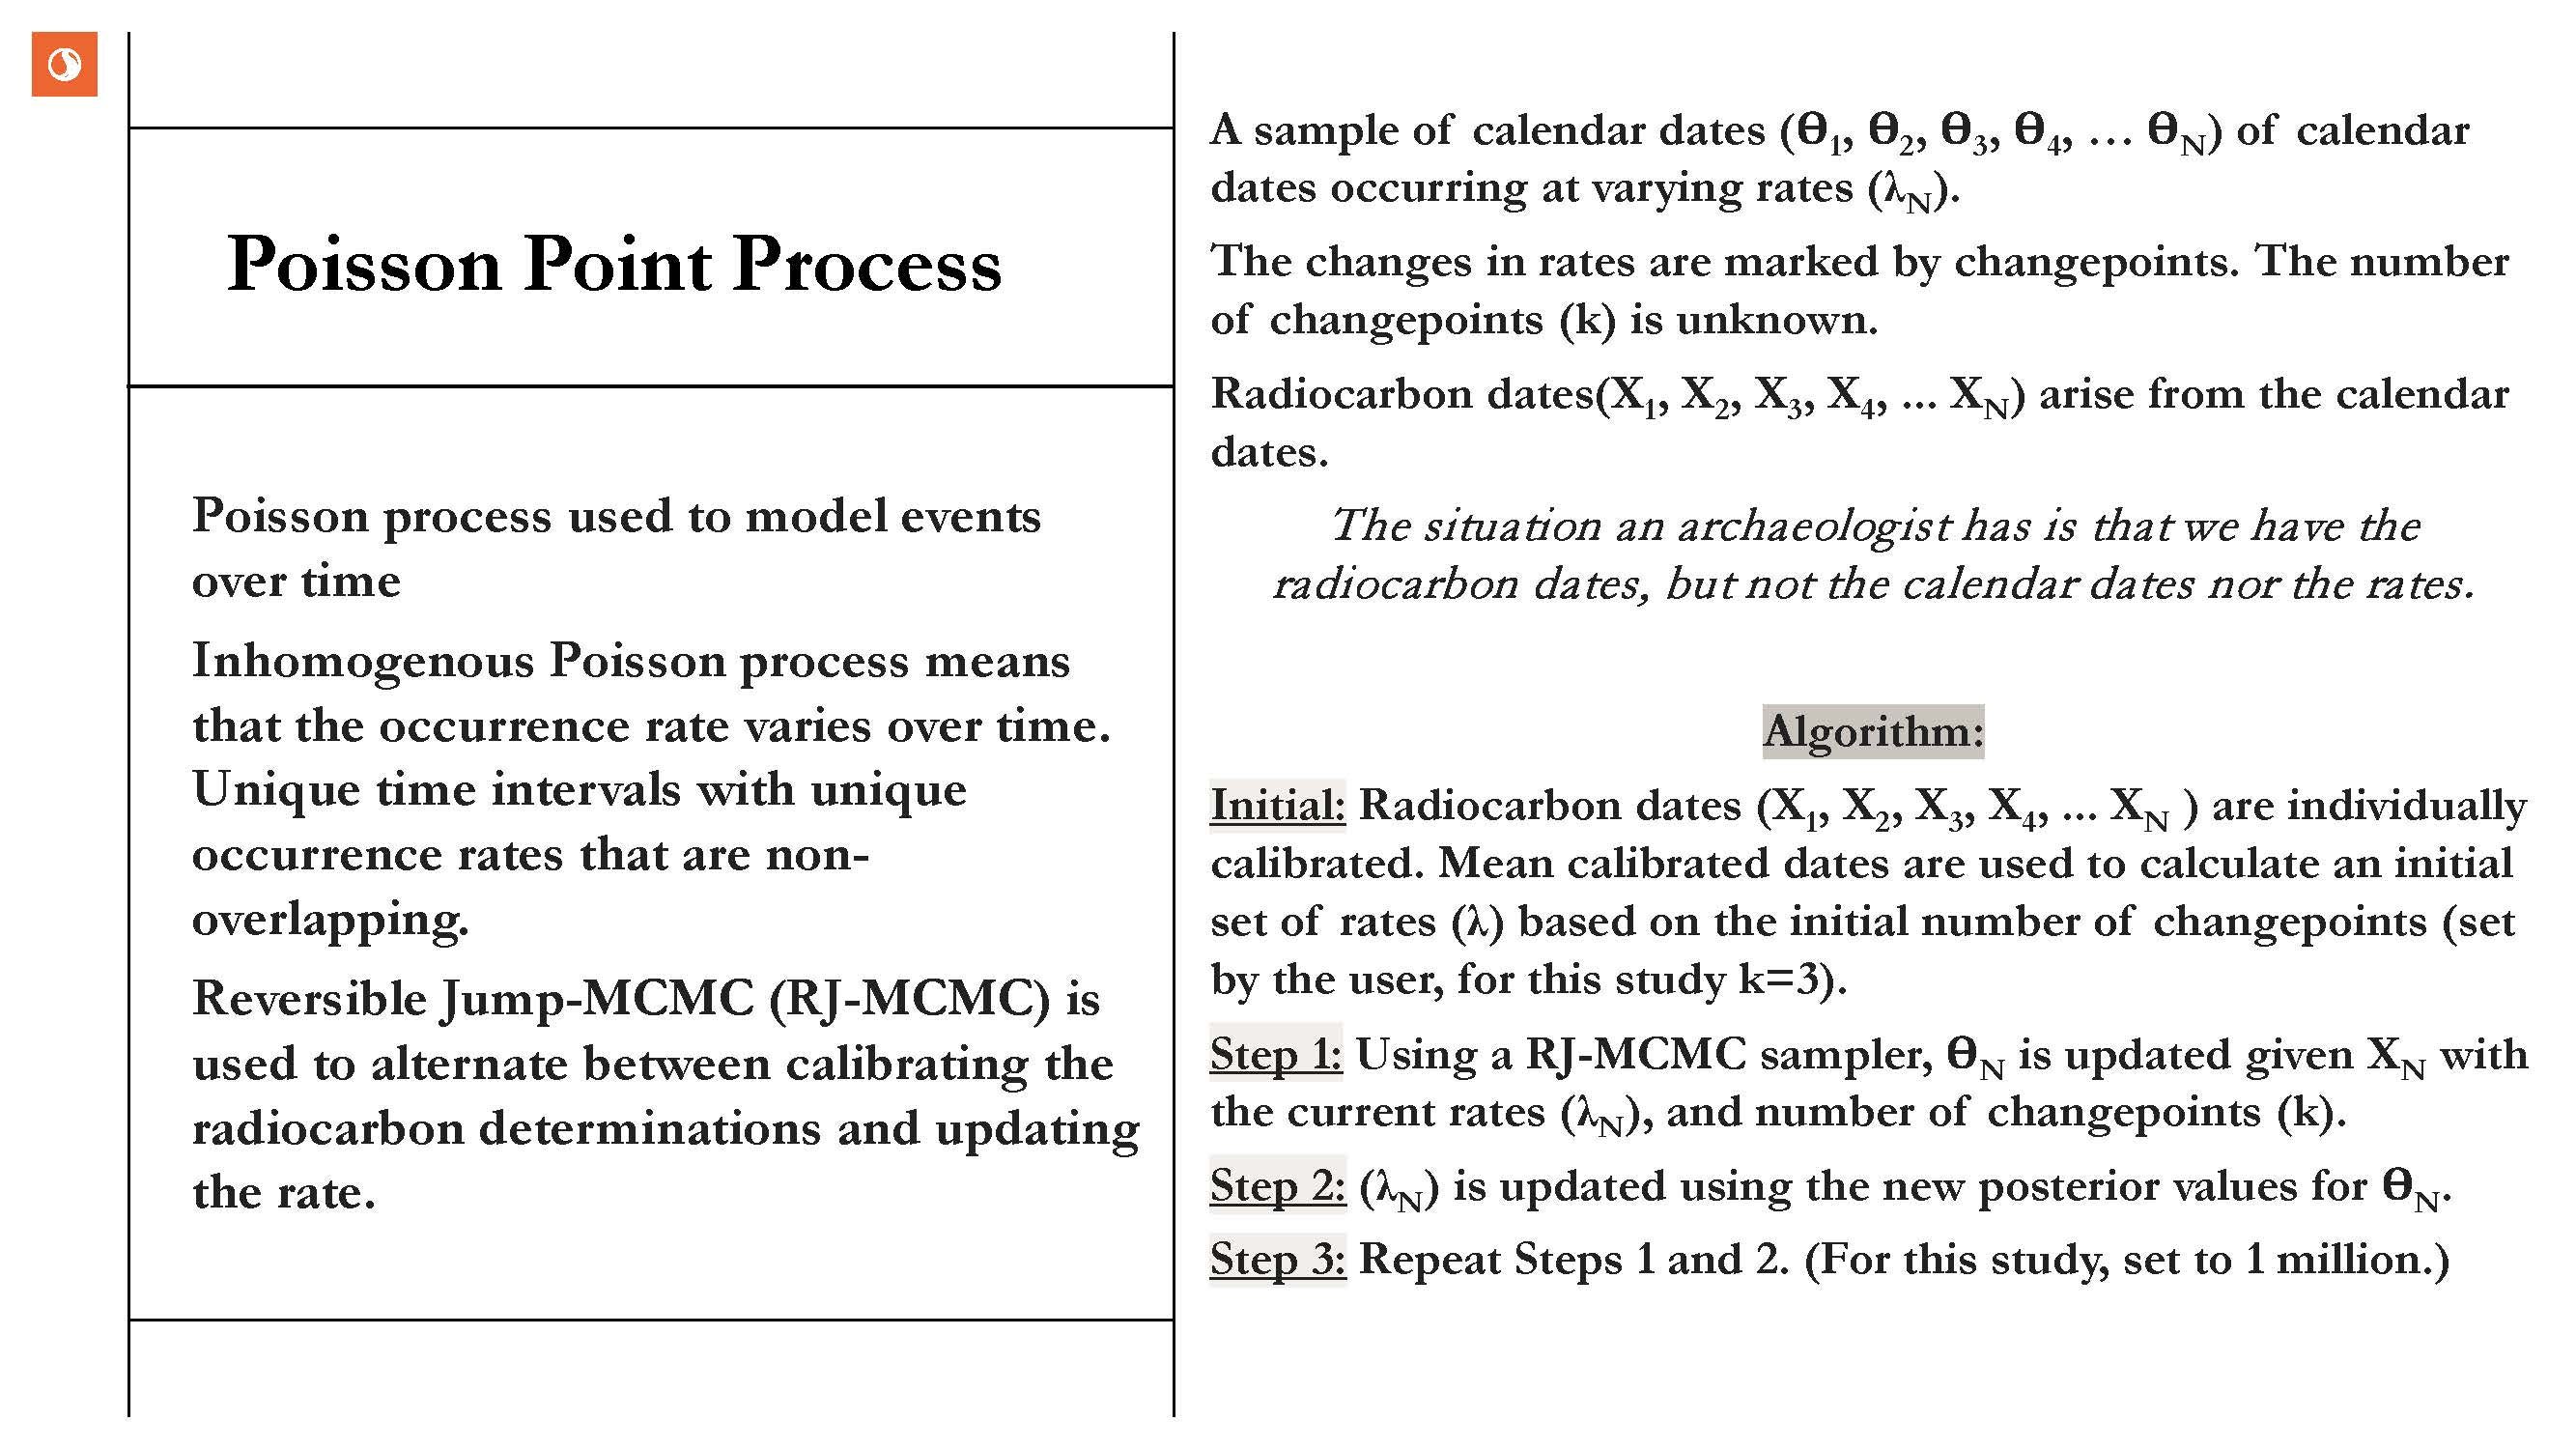
For this study the radiocarbon determinations (X1, X2, X3, etc.) are seen as arising from calendar dates (θ1, θ2, θ3, etc.) that follow an inhomogeneous Poisson process. This means the rate (events/yr) of events changes over time and is not constant. Poisson distributions are used for countable events or things, i.e. integers is the data type.
The approach employed here is non-parametric and utilizes a Bayesian methodology. Using the implementation in the R package carbondate (Heaton et al. 2025). The overall algorithm is explained on the slide.
For this study 1 million iterations are run, with a burn-in of half-a-million. Initial set of changepoints assumed to be 3. Took about 20 hrs. to run on a 4.5 GHz Intel 16 core CPU with 64 GB RAM.
The output at the end is a plot of the mean occurrence rate through time, the mean and 95% Credible Interval for the occurrence rate, and information on the change points. Rate information has to be pulled out separately.
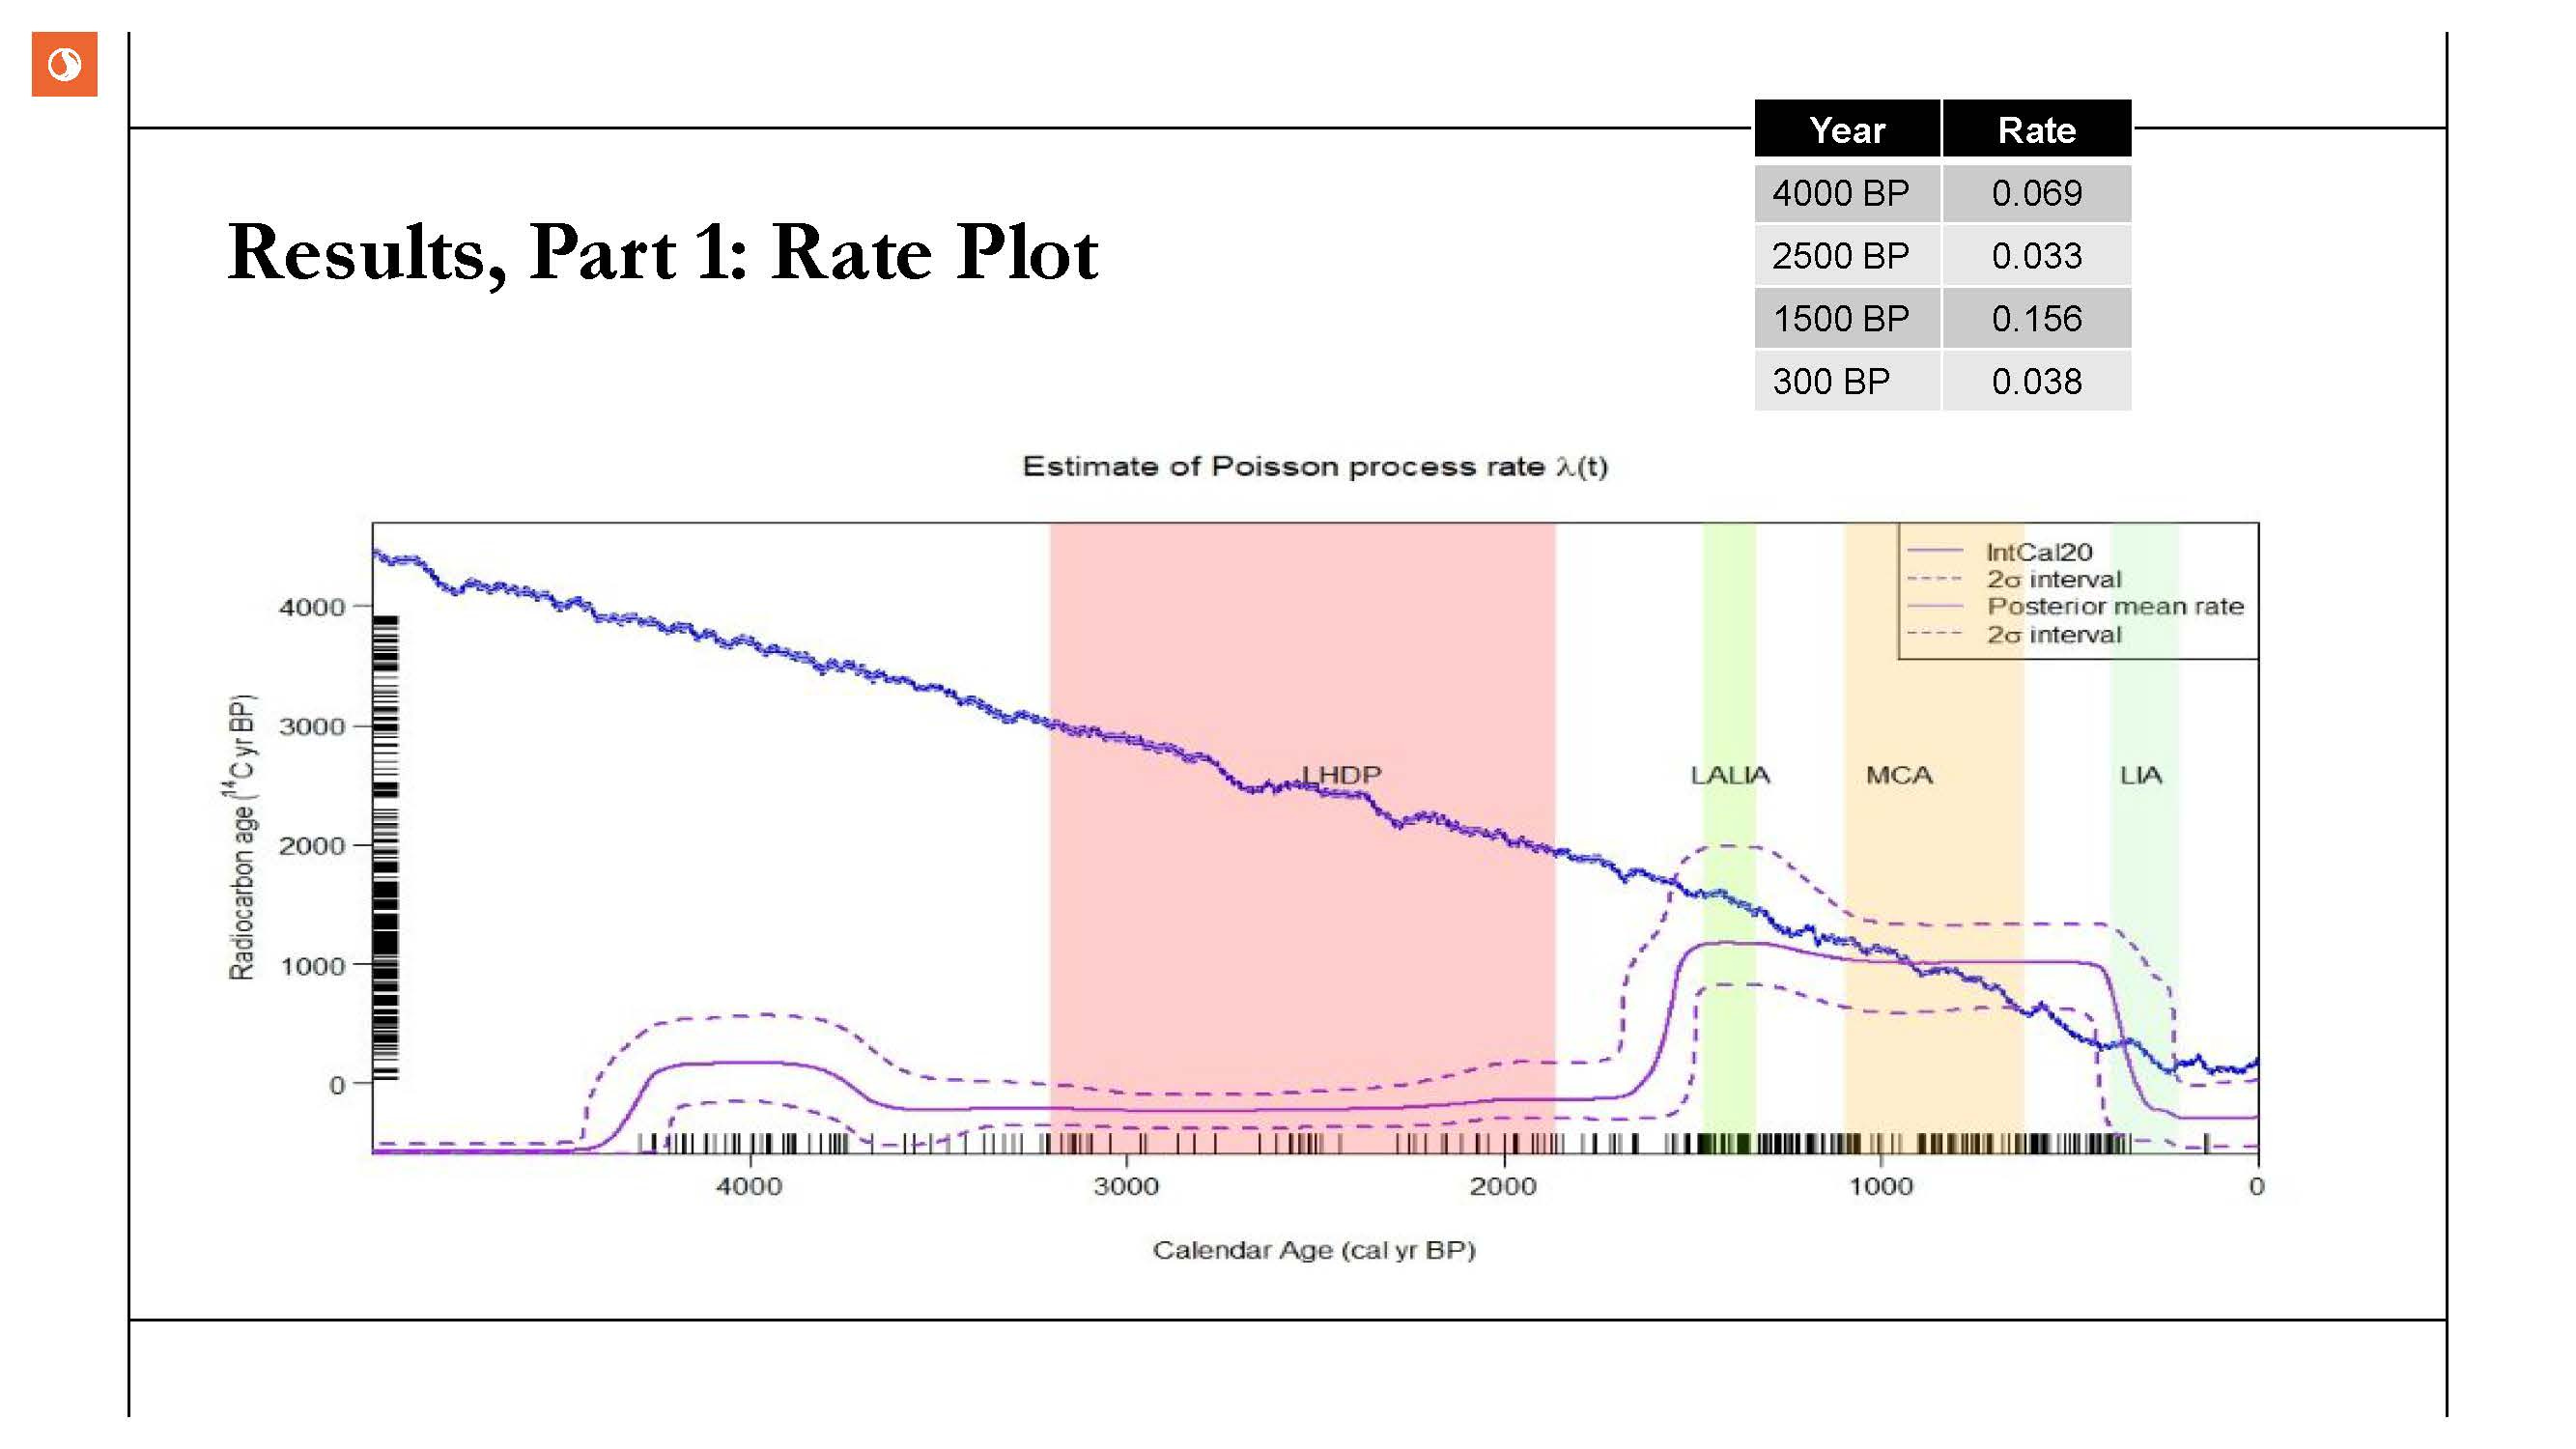
Note Y axis has 14C determinations, while X axis has mean posterior calendar dates. No scale for the rate. That gets pulled out separately.
Mean Rates--
ca. 4000 BP 0.069
ca. 2500 BP 0.033
ca. 1500 BP 0.156
ca. 1000 BP 0.145
ca. 300 BP 0.038
The way to view the rates is multiply by 100 and then that would be the number of dated events per century (so, during the LHDP, approximately 3 dated events per century).
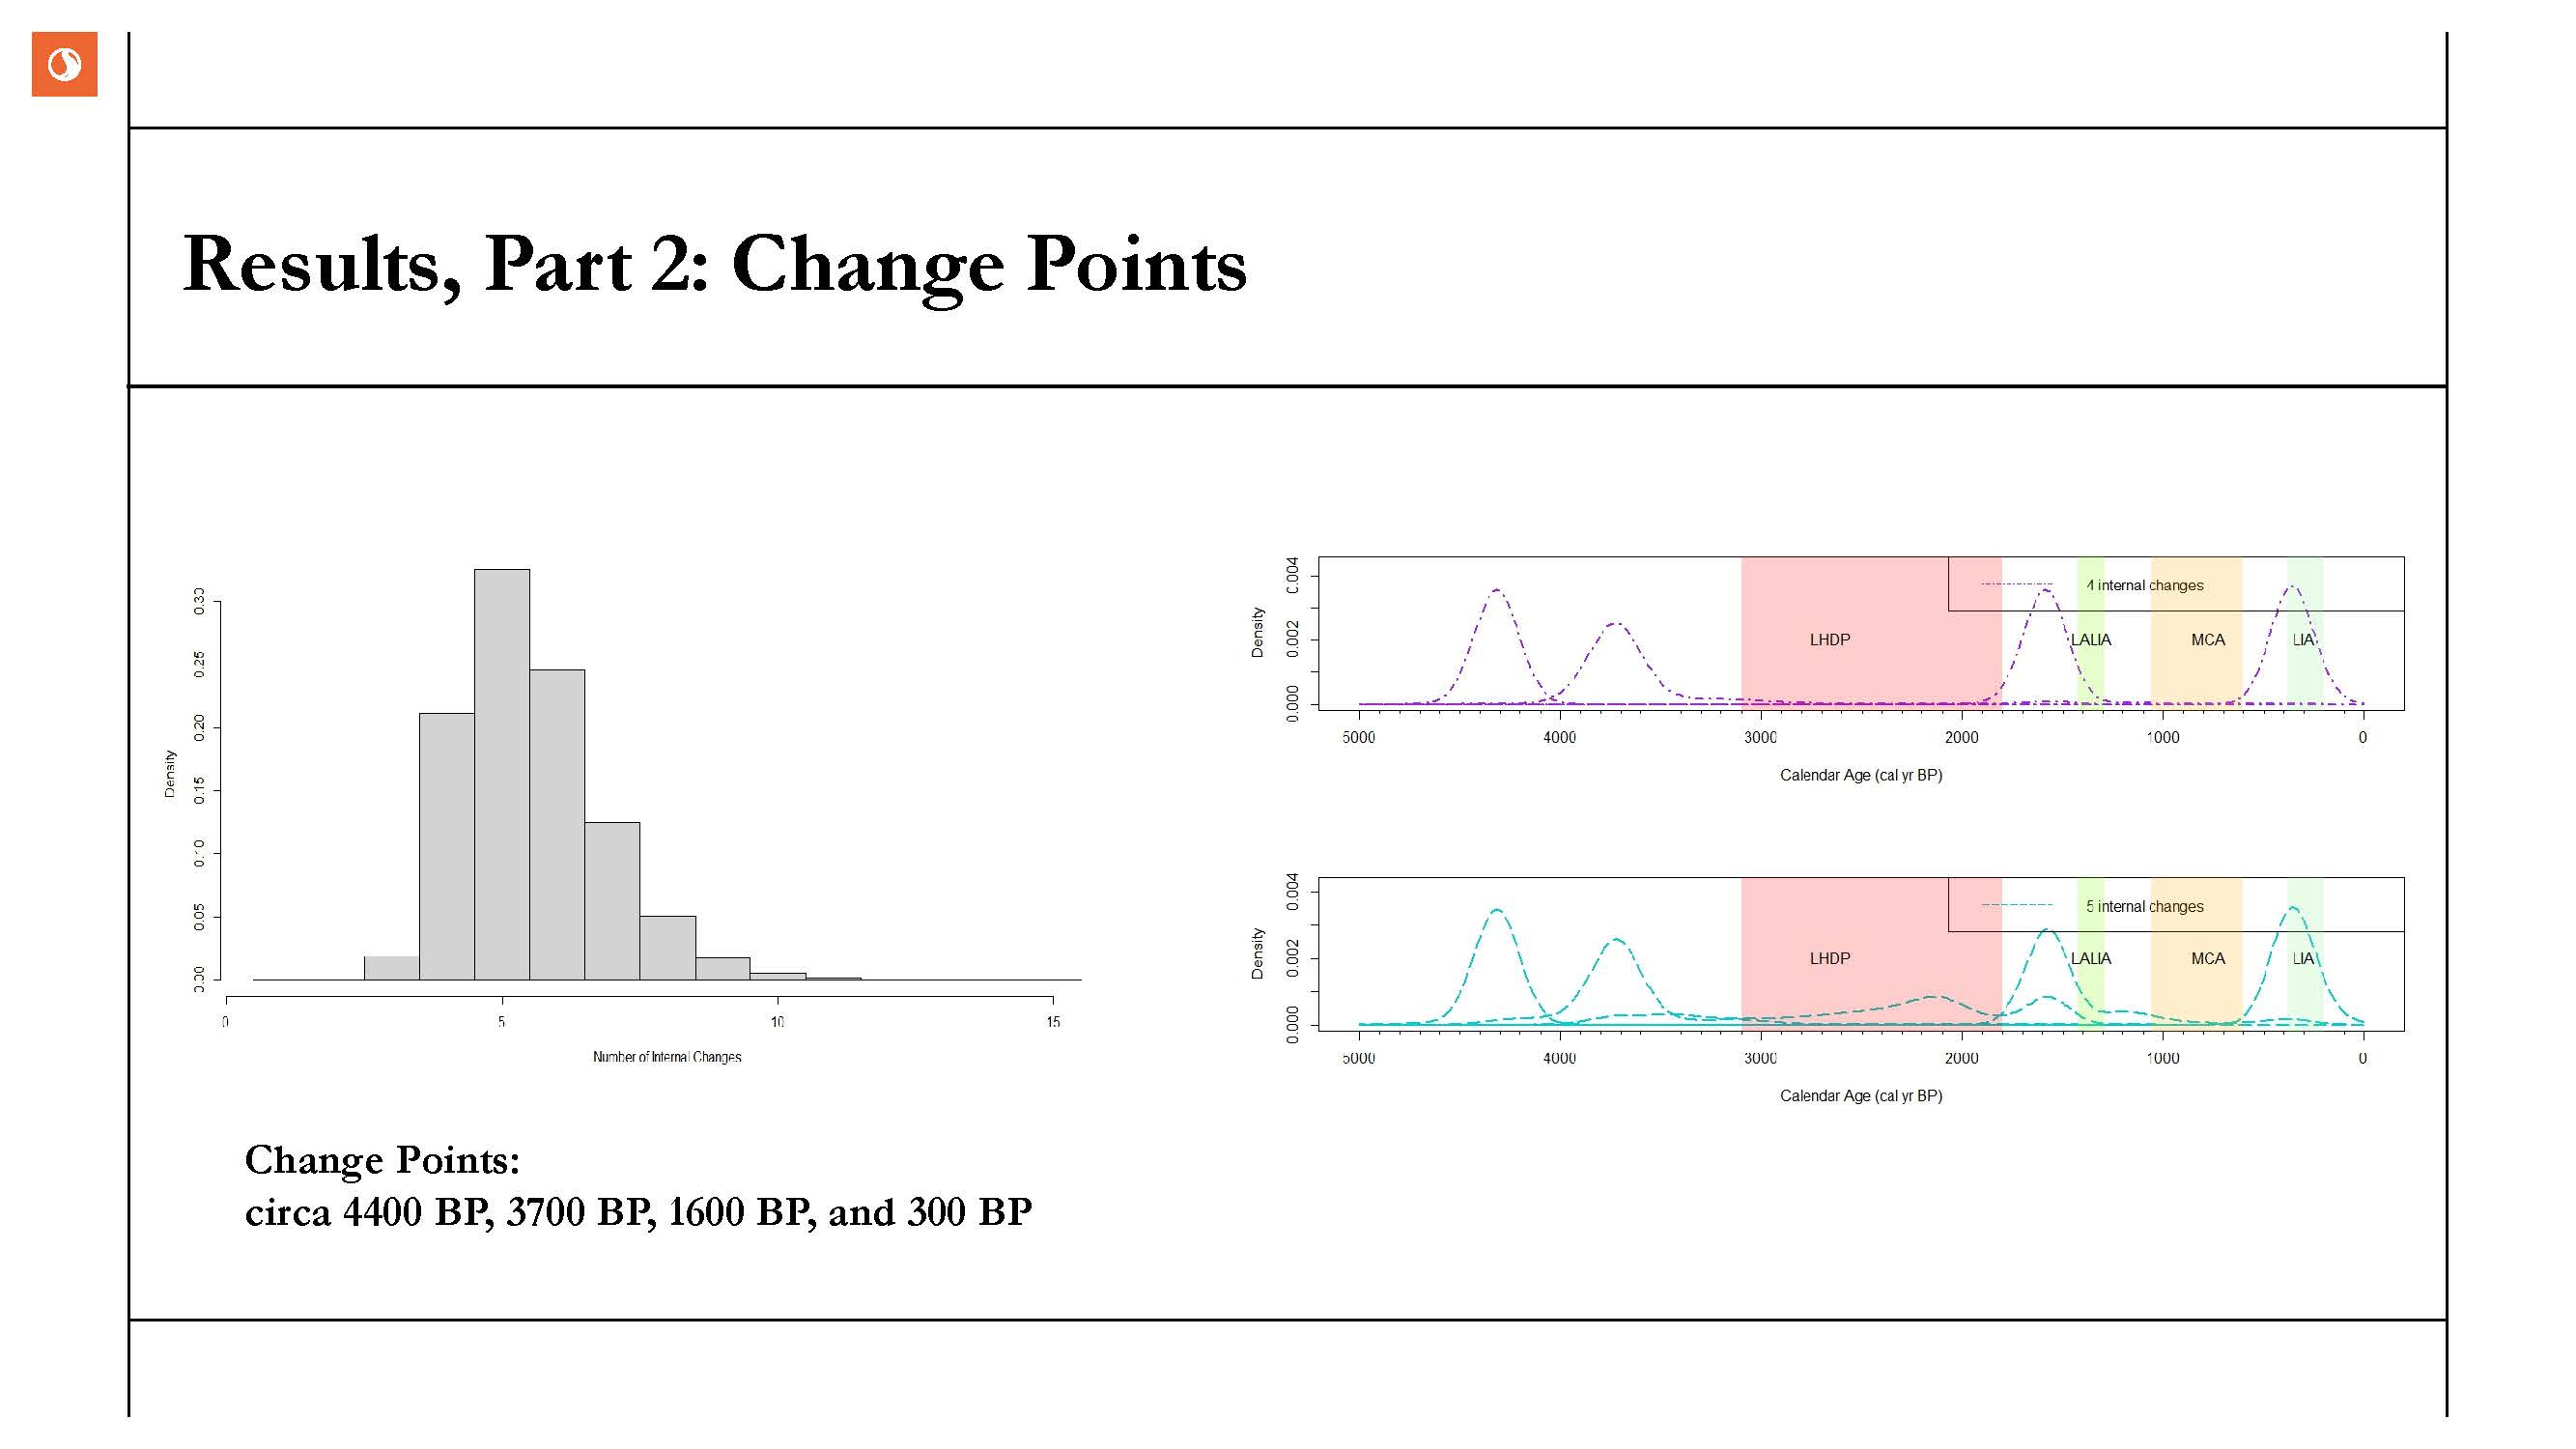
Most favored model is 5 changepoints. Fifth peak overlaps. Technically the 4 changepoint model fits better. Words to the wise—take a look at the results you get!
Change points:
ca. 4400 BP
ca. 3700 BP
ca. 1600 BP
ca. 300 BP
What do the Results mean?
Except for during the the LIA, changepoints for the occurrence rate do not overlap with the major climatic phases in the Great Basin. In the case of the LHDP, the decrease in the rate occurs before its onset. Only minor perturbations occur in the mean occurrence rate between the LALIA and the MCA.
It needs to be noted, that increasingly palaeoclimatologists have noted that the start and impact of major worldwide climatic phases are not uniform, nor their effect equal across the globe (see Mackay et al 2024; Neukom et al 2019). Also, it needs to be born in mind as Benson has noted, that the climate proxies used to measure climate effects may have a lag of several years.
Given that cautionary note, let’s look at the oxygen-18 isotope levels for Pyramid Lake.
Using Benson et al 2002 data. Dates are based on a linear intercept method from the original paper; probably need to be refined using a Bayesian methodology. Benson et al estimated 50-100 yrs error on the dating.
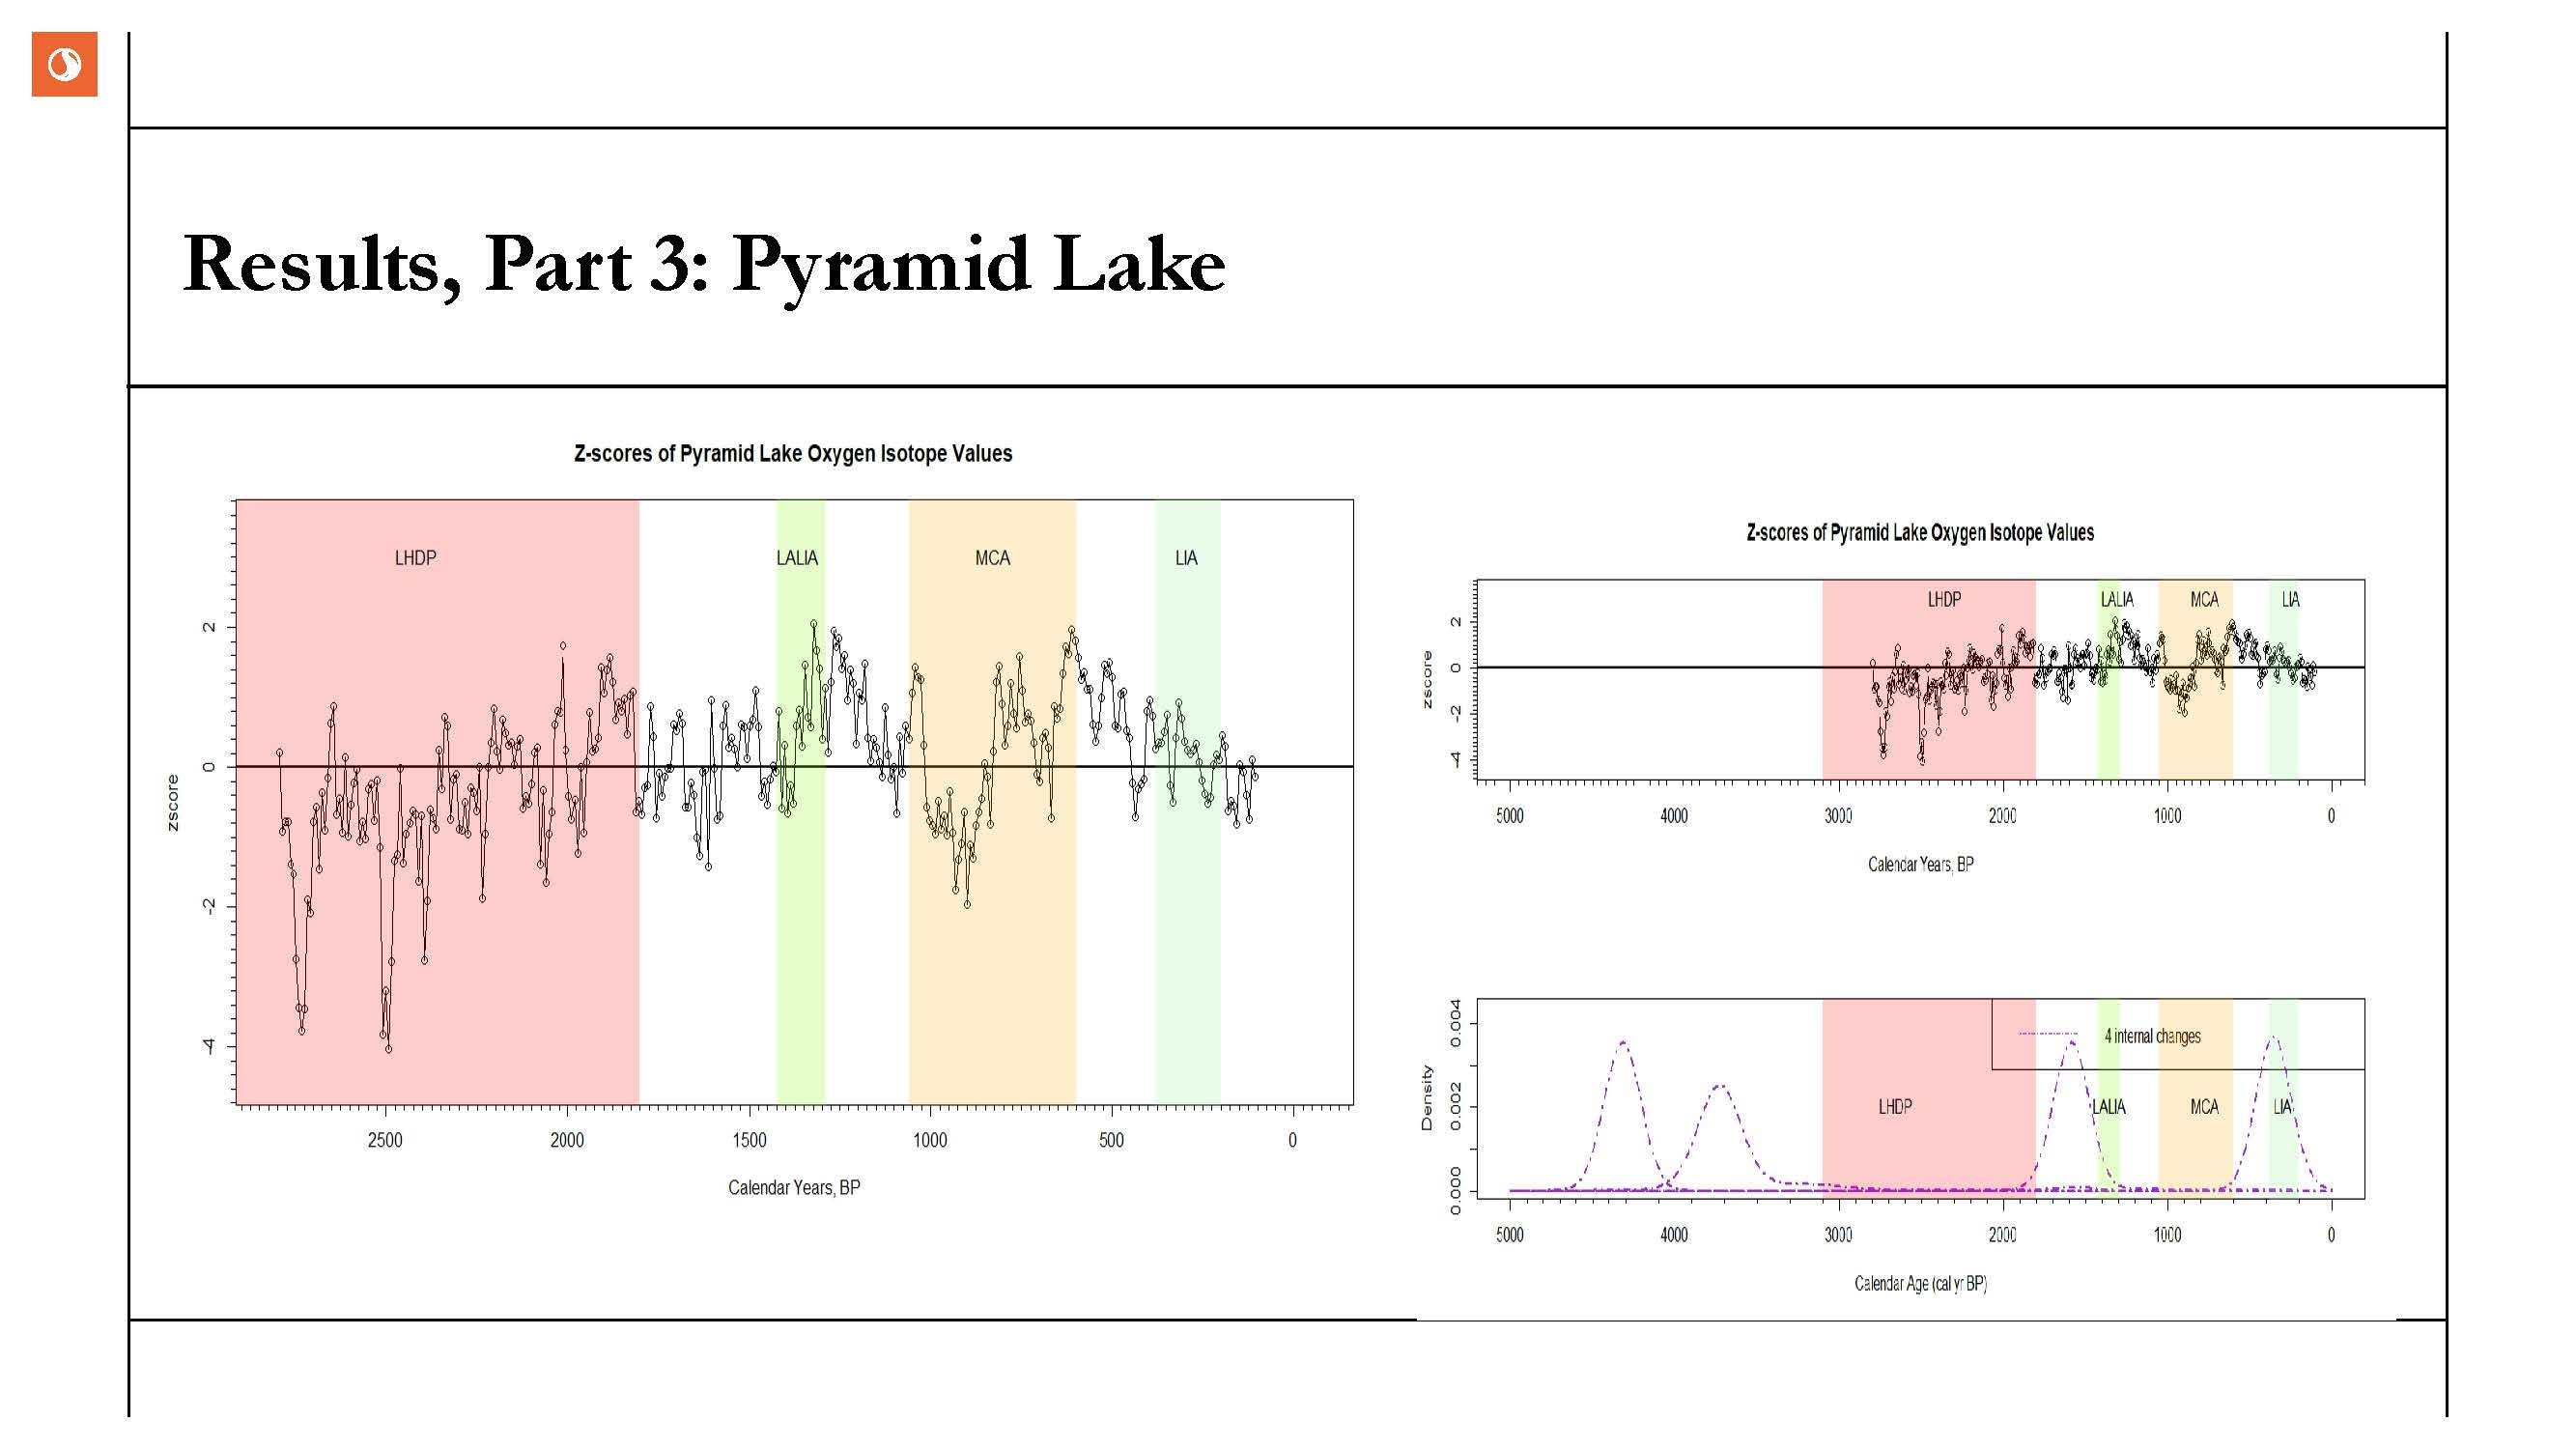
Z-scores of the 18O data. Positive indicates periods of drought, negative indicates wetter periods.
Some interesting things to note:
1. First half of the LHDP, oxygen isotopes indicate that the lake level isn’t really dropping. Not till the later half of the LHDP that 18O values increase indicate lowering of lake levels.
2. For the last 2500 years, drought is the dominant mode in the Truckee River Basin, no matter the climatic phase. Seen even in the LALIA.
3. Looking at change points in regard to Pyramid Lake’s oxygen isotope history, it does bear noting that there is overlap between the change point pre-dating LALIA and a non-drought period. In the case of the change point overlapping the LIA, the change point overlaps with drought.
The main point to take away is that at least for the Truckee River Basin, changes in the rate of events—which is seen reflecting human population levels is independent of the major cliamtic phases.
Aside from the LIA, changepoints do not coincide or overlap with the major climatic phases.
The post-2500 BP changepoints do coincide with droughts an pluvial periods documented in the Pyramid Lake oxygen isotope record. Determining whether they are correlated or nor requires more statistical tests.
The maximum occurrence rate occurs during the LALIA. Compared to the LHDP and LIA, the occurrence rate during the MCA is relatively high.
This is calendar years BP.
Radiocarbon years bp noted in this sentence.
Does anyone other than myself and Prof. Peregrine look at what goes on in North America during the LALIA?